How to Measure AI-Enabled Engineering Teams: 5 DORA Metrics That Actually Matter
AI is changing how software gets built. Engineering teams generate more code, move through implementation faster, and automate more of the development lifecycle than ever before.
But faster coding does not automatically mean better delivery.
For CTOs and engineering leaders, the real question is not how much code an AI tool produces. It is whether the team ships valuable software faster, maintains quality, and recovers quickly when something goes wrong.
That is where DORA metrics remain essential.
The latest DORA research on AI-assisted software development reinforces an important principle: AI can improve software delivery throughput, but it can also increase instability when review, testing, security, and deployment practices do not evolve with it.
The answer is not to abandon DORA. It is to measure DORA more intelligently.
Measure Delivery Outcomes: Not Code Volume
Lines of code, pull request counts, and AI-generated output are activity metrics. They show that work is happening, but they do not prove that engineering performance is improving.
AI-enabled teams need outcome-based measurement across two dimensions:
Throughput: How quickly and consistently does the team deliver?
- Stability: How safely does the team deliver and recover?
The five DORA metrics provide a strong foundation:
1. Deployment Frequency
2. Lead Time for Changes
3. Failed Deployment Recovery Time
4. Change Failure Rate
5. Deployment Rework Rate
Together, these metrics show whether AI is creating productive speed: or simply accelerating delivery problems.
1. Deployment Frequency
Deployment frequency measures how often a team successfully deploys changes to production.
A higher deployment frequency can indicate a healthy delivery system. Smaller releases, automated pipelines, and shorter feedback loops allow teams to deliver value continuously instead of waiting for large release windows.
AI can increase deployment frequency by accelerating:
- Code generation
- Test creation
- Documentation
- Pull request preparation
- Infrastructure configuration
- Routine maintenance work
However, deployment frequency should never be viewed alone.
If releases increase while incidents, rollbacks, and emergency fixes also increase, the organization is not improving. It is creating more instability at a faster rate.
How to Measure It in an AI-Enabled Team
Track production deployments by:
- Team
- Product or service
- Release type
- Environment
- AI-assisted or human-only contribution
The AI-assisted classification does not need to be perfect. A simple pull request label, workflow field, or repository convention can provide useful segmentation.
Then compare deployment frequency with change failure rate and rework rate. The goal is consistent delivery with controlled risk.
Action Prompt: Build a delivery dashboard that shows deployment frequency beside quality and recovery indicators.
2. Lead Time for Changes
Lead time for changes measures the time between a code change being committed or merged and that change running successfully in production.
This metric shows how efficiently work moves through the development lifecycle.
AI often reduces the time required to write initial code. But that is only one part of delivery. Engineering leaders should also examine whether AI-generated changes increase:
- Pull request size
- Review time
- Testing time
- Integration delays
- Security review effort
- Deployment complexity
A team may write code faster while still taking longer to deliver it if the review and validation systems become bottlenecks.
How to Measure It in an AI-Enabled Team
For each change, define:
- Start time: The first commit or merge to the main branch
- End time: Successful production deployment with the change operating as expected
Track the median and higher percentiles by team and service. Median lead time shows the typical experience, while higher percentiles reveal changes that become trapped in review, testing, or release queues.
Segment the data between AI-assisted and human-only changes when possible. This makes it easier to identify whether AI is reducing delivery time across the entire workflow or only accelerating implementation.
Improve the Full Delivery Path
AI delivers the greatest impact when the surrounding system is ready. Automated testing, CI/CD, clear ownership, and fast review cycles ensure that faster implementation becomes faster delivery.
ArkusNexus helps teams modernize this delivery foundation through DevOps and cloud services, including CI/CD implementation, infrastructure automation, monitoring, and ongoing optimization.
3. Failed Deployment Recovery Time
Failed deployment recovery time measures how long it takes to restore normal service after a failed deployment or service-impacting incident.
This metric reflects operational resilience.
Even high-performing engineering teams experience failed deployments. The difference is how quickly they detect the issue, understand the cause, and restore a healthy service.
AI can support faster recovery through:
- Log and telemetry analysis
- Incident summarization
- Runbook search
- Suggested remediation steps
- Automated alert correlation
- Drafted post-incident documentation
The metric itself remains straightforward. Measure the time from the start of a qualifying deployment failure to full service restoration.
Make Recovery Measurable
Define recovery events consistently. Depending on the organization, a qualifying event may include:
- A rollback
- A production incident
- A failed deployment
- An error-budget breach
- An emergency feature-flag disablement
Then connect deployment records with incident management and monitoring systems. Without this connection, recovery time becomes a subjective estimate instead of a reliable performance signal.
Action Prompt: Create a repeatable recovery process with clear ownership, automated alerts, and documented runbooks.
4. Change Failure Rate
Change failure rate measures the percentage of deployments that result in a production incident, rollback, hotfix, degradation, or other required remediation.
This is one of the most important metrics for AI-enabled teams.
AI makes it easier to produce and modify software. That creates more opportunities for defects, overlooked dependencies, insecure configurations, and changes that pass local validation but fail under real production conditions.
A rising change failure rate does not necessarily mean that AI should be removed from the workflow. It means the delivery system needs stronger controls.
Measure Failure Consistently
Define a failure before collecting the data. For example, count a deployment as failed when it:
- Causes a customer-impacting incident
- Requires an immediate rollback
- Requires an emergency patch
- Triggers an urgent feature disablement
- Creates a measurable service degradation
Then compare change failure rate by:
- Team
- Service
- Release type
- Change complexity
- AI usage level
The objective is not to punish teams for taking on difficult work. The objective is to identify where testing, review, architecture, or release controls need improvement.
5. Deployment Rework Rate
Deployment rework rate measures the percentage of deployments that require unplanned follow-up work soon after release.
This includes corrective deployments such as:
- Hotfixes
- Rollbacks
- Emergency patches
- Immediate configuration changes
- Quick follow-up releases to correct the original change
Rework is especially valuable to track in an AI-enabled environment because AI can increase code output faster than teams can validate and maintain it.
A deployment may not trigger a formal incident but still require significant corrective work. Rework rate captures that hidden cost.
Identify Productive Speed
Connect related deployments into a single change chain. If a deployment is followed by an unplanned corrective release within a defined period, classify the original change as rework.
Track rework alongside deployment frequency. More releases with less rework indicates improving delivery maturity. More releases with more rework indicates that the team is trading quality for speed.
Add AI-Aware Context to DORA
DORA metrics show delivery performance. They do not explain every reason behind the result.
AI-enabled teams should add a small set of supporting indicators:
- AI Code Share: The estimated percentage of a change created with AI assistance
- Code Turnover Rate: The amount of newly deployed code modified or removed soon after release
- Review Latency: The time between pull request creation and first meaningful review
- Change Size: The size and complexity of AI-assisted changes
- Innovation Rate: The share of work dedicated to new product capabilities instead of rework or maintenance
- Developer Experience: Whether engineers can work effectively with the new tools and processes
These metrics provide context without replacing DORA.
For example, rising deployment frequency may look positive until code turnover and rework reveal that the team is shipping changes that do not remain durable. Likewise, a higher change failure rate may be concentrated in a specific service or class of high-complexity work.
Good measurement reveals where to improve the system.
Build a Measurement System Engineers Trust
Metrics succeed when engineers see them as tools for improvement: not surveillance.
DORA metrics should be used at the team, service, and organizational level. They should not be used to rank individual developers or reward superficial activity.
A practical measurement approach includes four steps:
1. Establish a baseline. Measure current delivery performance before expanding AI adoption.
2. Tag AI-assisted work. Use pull request labels, workflow metadata, or repository conventions.
3. Connect delivery systems. Integrate Git, CI/CD, monitoring, incident management, and feature-flag data.
4. Review throughput and stability together. Never celebrate speed without checking quality and recovery.
The 2025 DORA research on balancing AI-driven tensions makes the broader lesson clear: AI amplifies the strengths and weaknesses of the system around it.
Strong engineering practices become more valuable. Weak handoffs and unclear ownership become more expensive.
Move From AI Adoption to AI-Native Delivery
The best engineering organizations do not measure AI by how many prompts developers send or how much code an agent generates.
They measure whether the complete delivery system performs better.
That means combining:
- Faster implementation
- Smaller and safer releases
- Automated quality controls
- Strong security practices
- Reliable production environments
- Fast incident recovery
- Human accountability at every critical gate
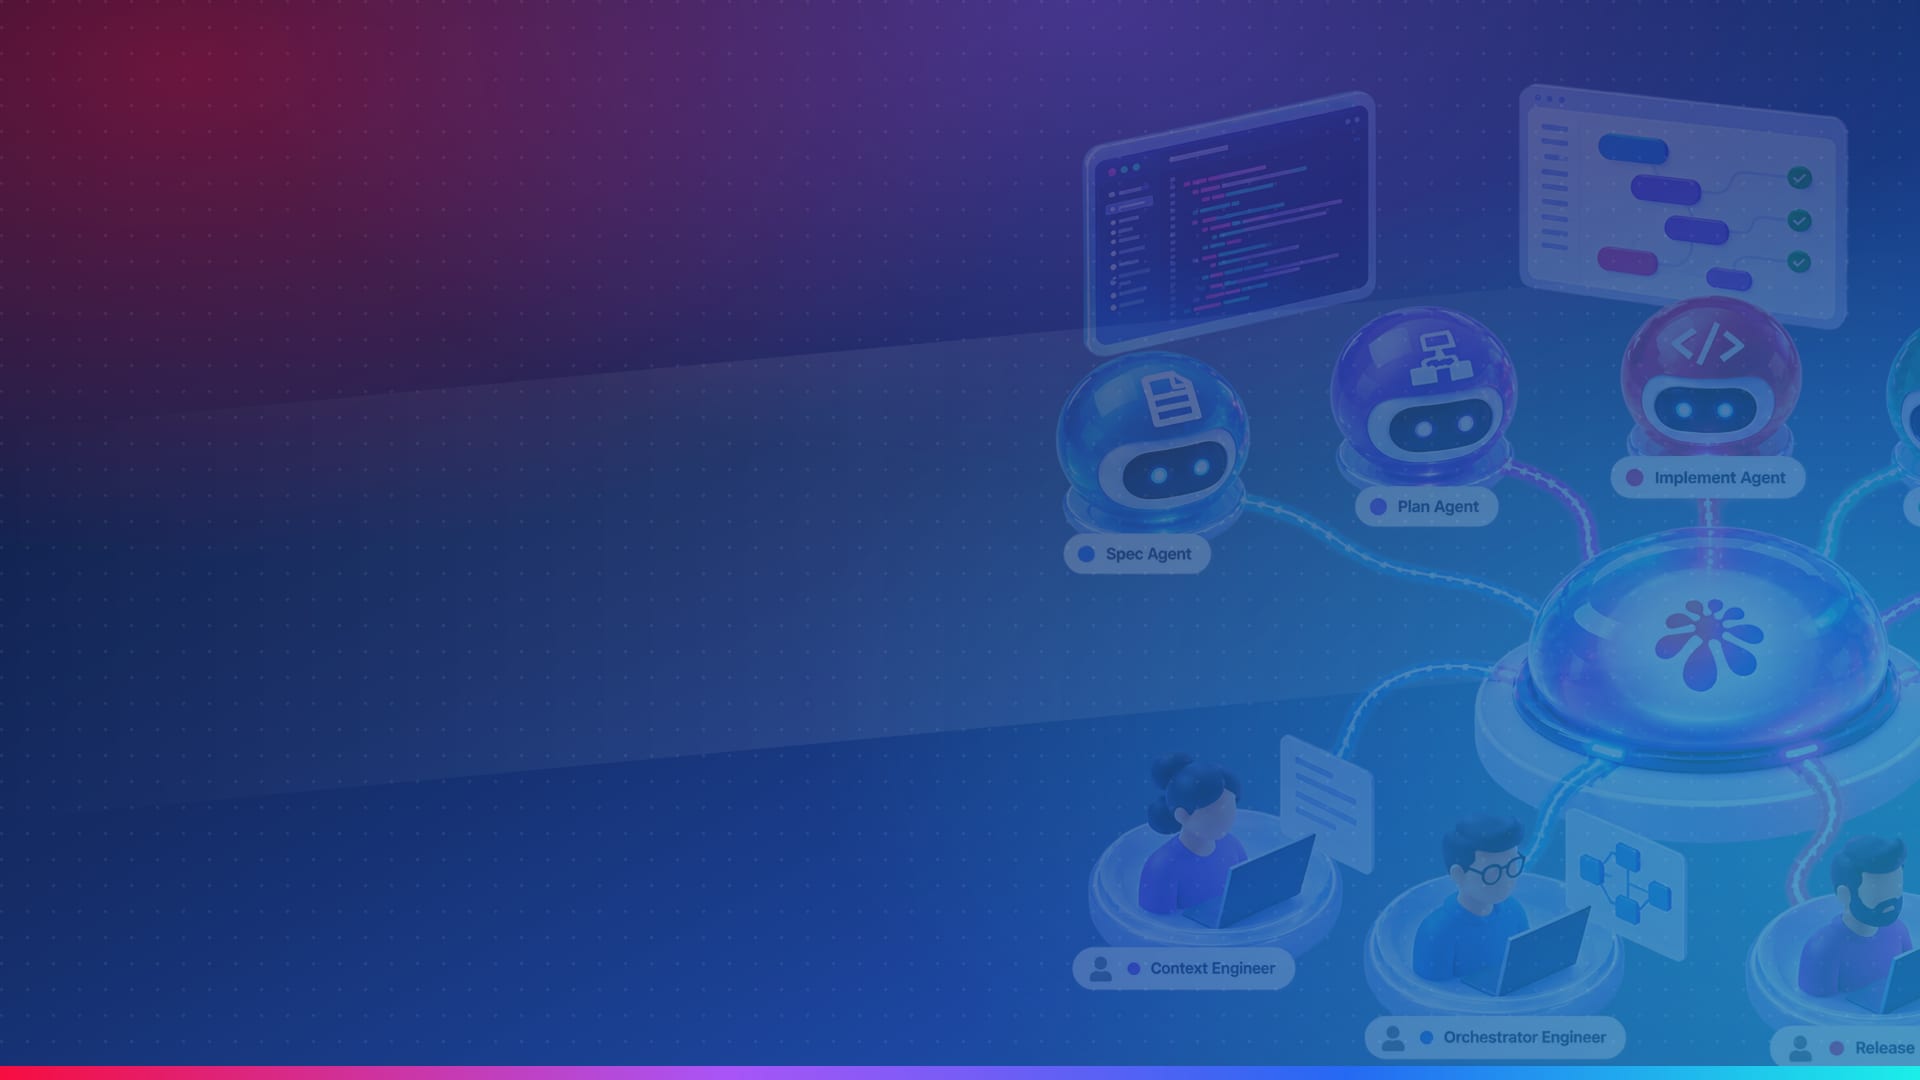
At ArkusNexus, our AI-Native Software Development POD pairs senior engineers with specialized AI agents across specification, planning, implementation, review, and deployment. Human experts own the decisions while AI accelerates the execution.
The result is not simply more code. It is tested software, complete documentation, quality environments, and production-ready delivery.
Explore our AI solutions or AI/ML development services to establish an AI-enabled delivery model built for speed, quality, and scale.
Measure smarter. Ship faster. Build with confidence.